WHAT IS PROMETHEUS MONITORING?
Instant visibility into clusters, infrastructure, and workloads.
PROMETHEUS SETUP
Start fast, get insights even faster.
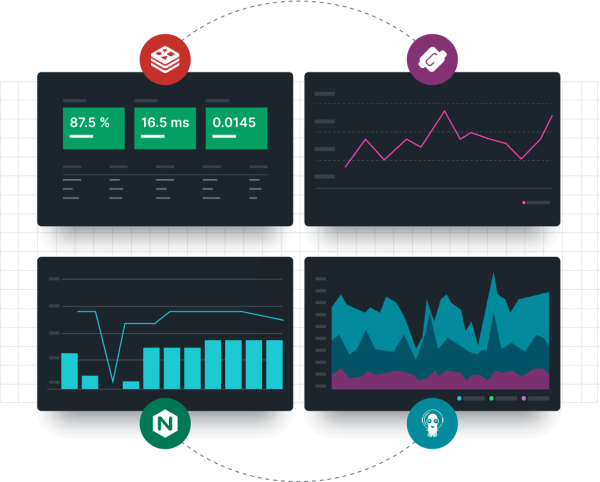
- Automatically collect Kubernetes performance metrics from ArgoCD, CoreDNS, NGINX, Redis, Calico, and more.
- Use pre-built dashboards and alerting policies to analyze clusters and services—no manual setup.
- Delete data silos—analyze, collaborate, and alert on Prometheus data and telemetry in one view.
- See and alert on all your Prometheus data, even if you prefer to work in Grafana.

SCALE AND PERFORMANCE
Get long-term data storage, all in one place.
- Combine data from all of your Prometheus servers on a single observability platform.
- Dial down local resources with 13 months of retention in New Relic.
- Easily send Prometheus metrics to Grafana to view using your existing dashboards.
SIMPLIFIED CONFIGURATION
Take control of every byte of your Prometheus data.
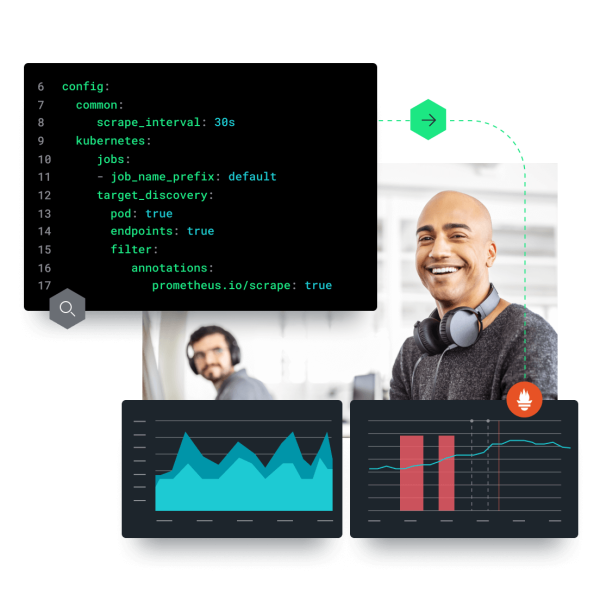
- Readily adjust per-target scraping intervals to suit your observability needs.
- Effortlessly reduce ingest by filtering metrics or removing labels.
- Monitor services more efficiently using service discovery or static targets.
- Scale vertically and horizontally using Prometheus agent mode with agent sharding.
