WHAT IS NEW RELIC EXPLORER?
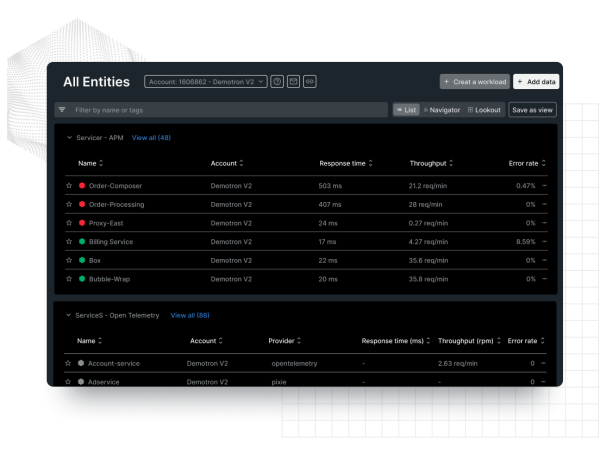
The one place to see across your entire stack in a glance.
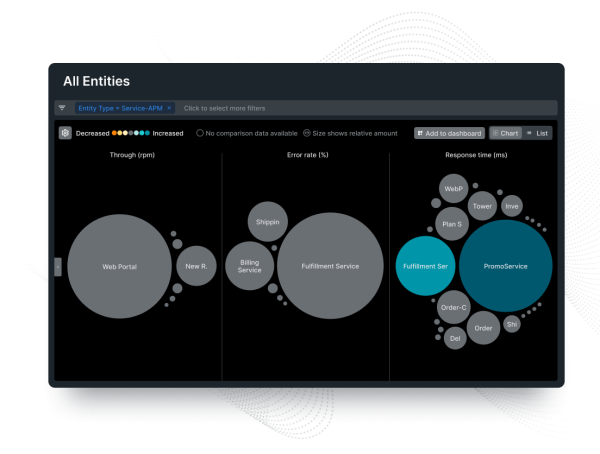
Catch sudden changes with Lookout.
- Easily visualize your system and focus attention on issues with an intuitive, color-coded dashboard.
- See changes in all your telemetry, even third party and open source—no configuration needed.
- View abnormal history, correlations, and traces to know how changes impact your whole system.


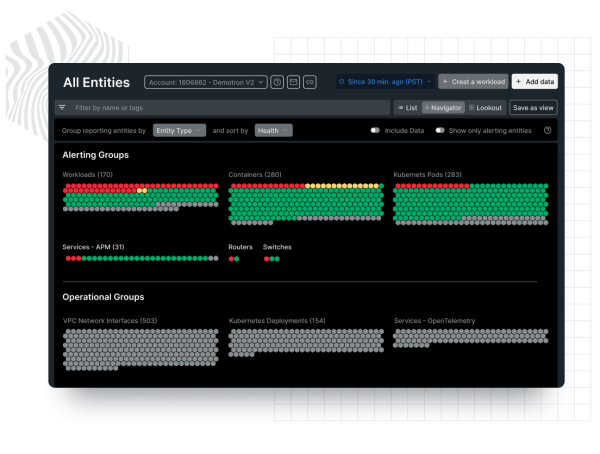
See system health at a glance with Navigator.
- Get an estate-wide view filtered by entities and displayed with traffic-light colors based on alerts.
- Easily filter, group and sort entities organized by tags to instantly zero in on issues.
- Quickly explore all your hosts, containers, and services belonging to all your accounts.
Go deeper and troubleshoot faster with related entities.
- See all the entities related to a specific host, application, container or integration.
- Quickly understand which upstream or downstream services are related to an issue.
- Pinpoint root causes by tracking relationships and dependencies across your system.

Look who
has us open.
has us open.
1


